Calibration Techniques for Ultrasonic Tension Measurement
by:
Dave Archer | Principal Engineer
Peak Innovations Engineering
9934 N. Alpine Rd., Suite 104
Machesney Park, IL 61115 USA
The fundamentals of using ultrasonic pulse-echo technology for bolt strain measurement, detecting the change in the time required for a pulse of energy to travel the length of the fastener after elongation, can be performed with very good resolution and repeatability. The challenge is utilizing this core capability in a manner such that the resulting calculation of boll tension is also accurate and repeatable. Traditionally, the primary barriers to this have been in three areas maintaining a stable bolt-sensor interface where the pulse passes into and out of the fastener, accounting for the influence of temperature on the measurement, and providing an accurate means of converting a given change in the pulse’s time-of-flight (TOF) to usable units of tension or load.
The last is generally refined to as calibration. Recent developments that affix the sensor to the fastener, leaving the bolt-sensor interface a fixed and permanent condition, have largely solved the interface instability problems associated with separate sensors and liquid coupling. Temperature management and compensation remain a challenge to a varying degree for both ultrasonics and other measurement techniques. As issues and solutions to temperature management are very application-dependent they will not be covered in this article. In general, the desire is to minimize temperature differentials and gradients. Conversely, the means of effectively converting TOF to tension can be discussed in a manner that is widely applicable and will be the subject of this article. An attempt will be made to address both experienced and novice practitioners.
OBJECTIVE
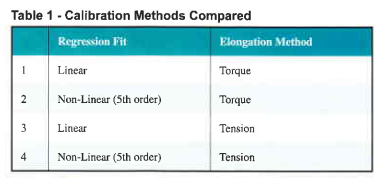
We will compare the effectiveness of common calibration methods for use in both the elastic and plastic range of elongation. These methods are summarized in Table l
In these four methods, a fastener under calibration is increasingly loaded, both the TOF of the ultrasonic pulse and the load required to produce the elongation (and increase the TOF) are monitored. A series of load/TOF data pairs are produced for each sample and once all samples have been calibrated regression analysis is run to predict the bolt tension for a given TOF Figure I illustrates the relationship between bolt elongation and the resulting bolt tension. Line A-B-C represents the behavior of a bolt loaded into yield, with permanent elongation occurring after point B. While this trace is often produced by pulling the bolt in a tensile tester, compressing a load cell by rotating the bolt into a nut member produces the same effect.
Finally, since the change in TOF is directly proportional to elongation, line A-B-C also represents the response of an ultrasonic sensor as measured by TOF. As most bolted joints are designed for bolt load to remain within the elastic range (Line A-B), it is common to calibrate within this range only and produce a simple linear estimate for Load vs. ATOF. These linear calibrations can also be used to measure tension in bolts that have been permanently elongated by taking the installed tension measurement, fully loosening the bolt, and measuring the residual ” tension” due to permanent elongation and subtracting this residual value from the initial reading. Because a linear relationship between TOF and load treats all changes in TOF the same, a given increase in elongation produces the same estimate of increased load in all situations.
Therefore, when the actual relationship between elongation and load follows Line B-C, the ultrasonic system with linear calibration will incorrectly predict load along Line B-C2. However, the final TOF will be the same in both cases. When loosened, the bolt’s elastic elongation is relieved by following the same path as during the elastic phase of tightening: Line C-D (parallel to Line A-B). The residual “tension” displayed on the ultrasonic measuring system will be Point D2, based on the TOF at Point D. This differential load, represented by Line D-D2, is equal to the differential load represented by Line C-C2 as the lines are of equal length. Subtracting load D2 from the value at Point C2 yields the connect value: Point C.
Some users with the capability for non-linear calibration use it for all applications whether or not the bolt is to be permanently elongated although the capability for nonlinear calibration is not available in all measurement systems. So the calibration method that will be used for a given application is not always a given, particularly considering the fact that both tensile and torque-based loading methods are possible.
This is the motivation for comparing the effectiveness of the four options summarized in Table 1. TEST PROCEDURE The approach taken was to generate calibration files using the four combinations of regression fit and elongation, then tighten a series of bolts in a load cell and compare the ultrasonic tension calculated using each of the four calibrations to the output from the load cell. The load cell would be considered the control and deviation from the load cell would be considered measurement 9rTor.
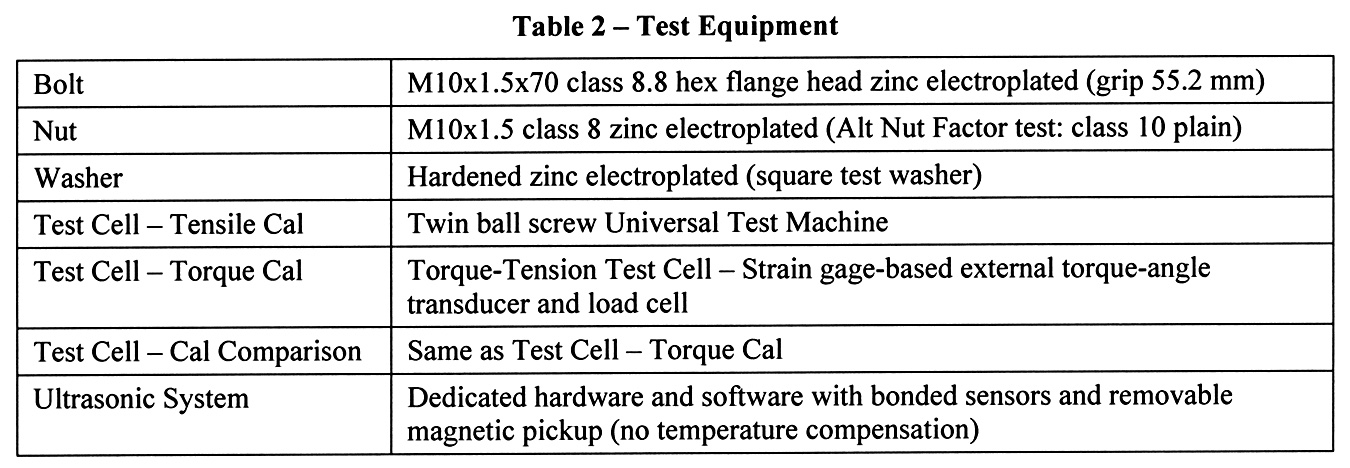
The equipment used in the test is summarized in Table 2. Class 8.8 bolts were chosen for convenience, but all the trends shown here are applicable to other property classes. As noted, the setup used to conduct the comparison test is the same one used for the torque calibration. To enable the most direct comparison of linear and non-linear calibration, the linear calibration was not created with an independent set of samples, but rather a series of data pairs generated over the full range of elongation into yield was cropped so that just the points recorded in the elastic range remained.
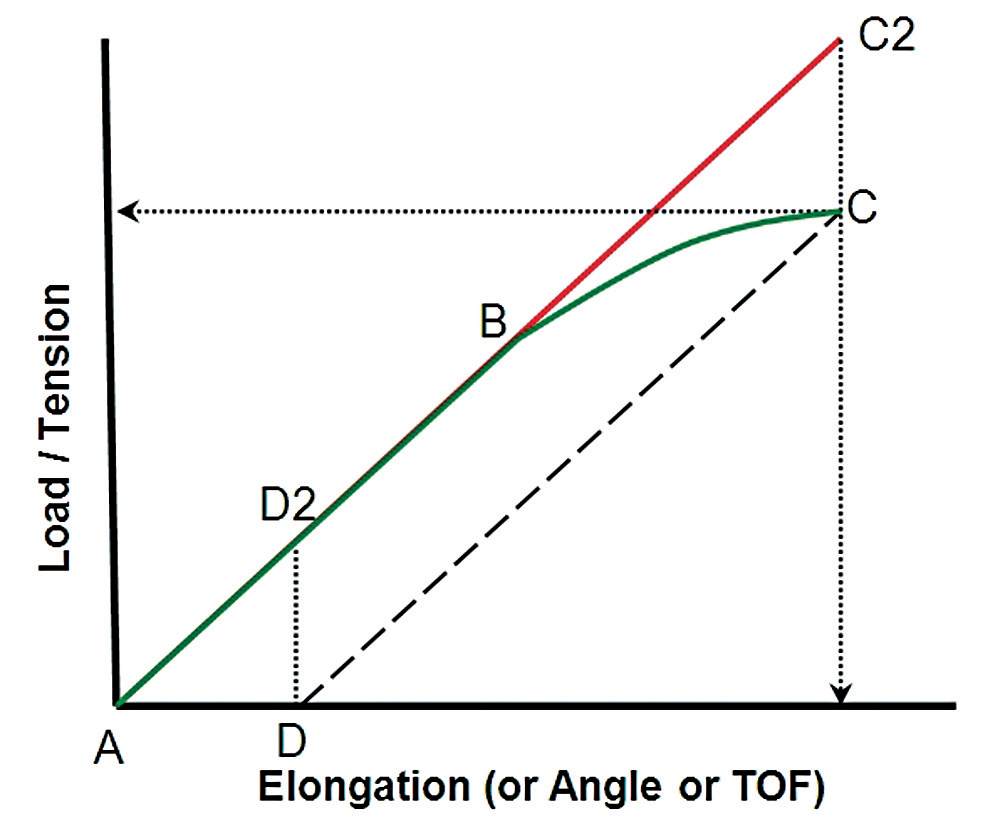
Fig. 1 — Load vs. elongation into yield with a notation on correcting linear calibrations for plastic deformation.
TEST RESULTS
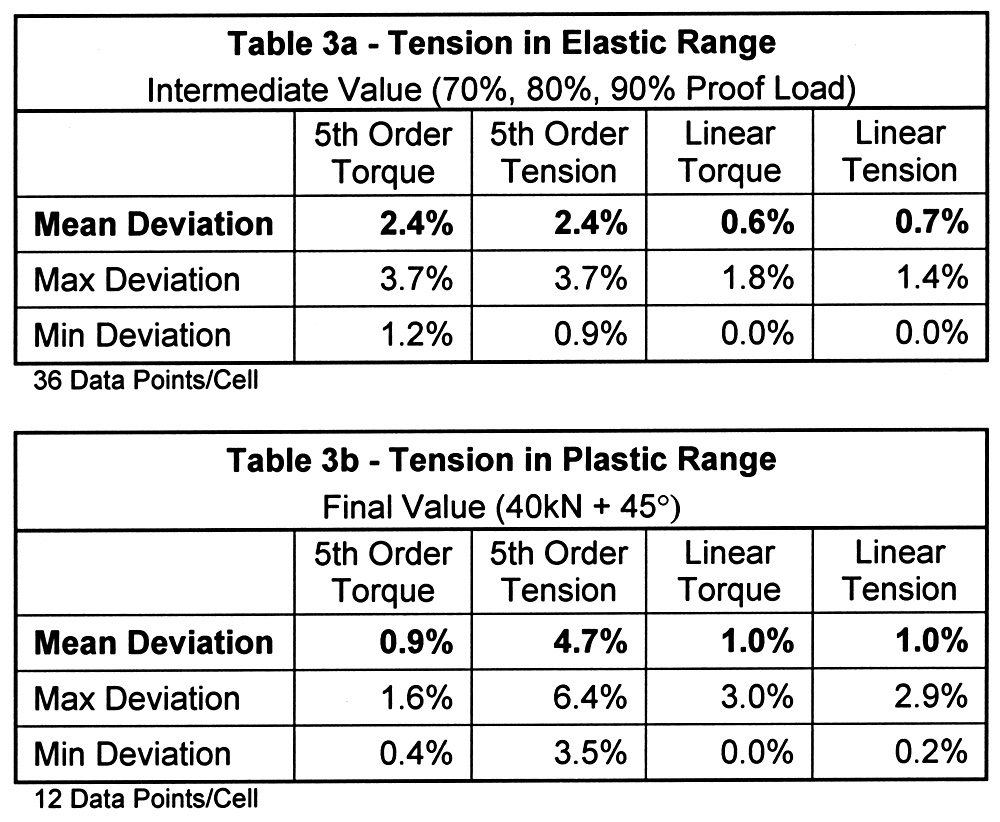
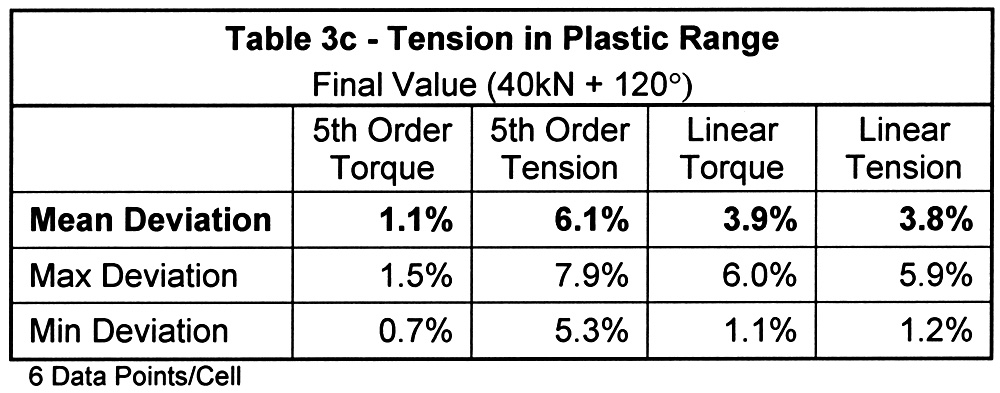
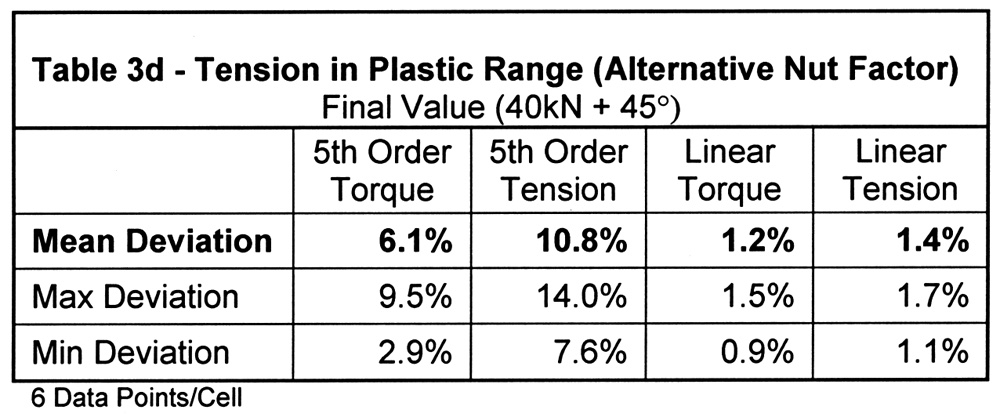
The results of comparing load cell tension to tension calculated from the four forms of ultrasonic calibrations are summarized in Tables 3a through 3d. Each table covers a different measurement scenario. Table 3a is a compilation of intermediate measurements, all within the elastic range, taken at the most common design targets the bolt tension. The three subsequent tables are the final tension readings for bolts elongated into yield. The difference between Tables 3b and 3c is how far into the plastic range the bolt was elongated. Table 3d is unique as in all other cases the bolt, nut, and washer used for the comparative tests were the same used for calibration. The results shown in Table 3d reflect the use of a plain finish nut rather than the zinc-plated nut used in all other cases. In all tables, variation is defined as the absolute value of the difference in ultrasonic tension relative to load cell tension.
COMMENTS ON TEST RESULTS
The difference in tension calculated by linear torque and tension calibrations was approximately 0.170. This reinforces our past experience showing the elastic range elongation method can be equally accurate. It may seem odd that the non-linear calibrations resulted in about three times the deviation when the linear calibrations were derived directly from them. The reason is shown in Figure 2. Even when using 5th order regression, the portion of the calibration covering the proportional elastic range deviates from linear. While the tensile method of calibration allows the use of cal bolts for testing, as the contact surfaces are unaltered, one tends to need more care in establishing grip length in tensile calibration due to the nature of the tooling. This is particularly true as grip length decreases. To approximate the small increase in stiffness of advancing the bolt during torque calibration we set the grip length for tensile calibration sort of calculated value by 10/0 of the thread pitch (half the rotation assuming it was 72o from the threshold). Where possible, it is desirable to simulate actual thread engagement as this influences bolt stiffness, and therefore calibration.
The three tests conducted in the plastic range highlight the advantages and disadvantages of each calibration. First, the tension-based nonlinear results show greater deviation than those which are torque-based. The reason for this is also the reason the non-linear calibrations perform poorly in Table 3d. In both cases, the limit of the proportional elongation is reduced by the addition of torsional stress. This is illustrated in Figure 3 highlights the area around the yield of three tension-angle traces recorded on the torque test cell. The three traces are the calibration and primary test hardware (nut factor K=0.164), the plain nut used only in the Table 3d test (K=0.184), and a third set tested for this illustration only (K=0.273). If the trace from a pure tensile pull were added, the proportional limit would be still higher than that of the primary test hardware.
Fortunately, because actual fastener proof loads are often 15% to 20% higher than minimum requirements, finishes with reasonably low nut factors result in proportion limits above minimum proof. The increasingly indistinct deviation from proportionality that occurs with increasing tensional stress should be kept in mind when analyzing torque-angle or tension-angle traces, as it can be mistaken for the onset of embedment.
Another finding of the measurements into yield is the process of using linear calibrations and subtracting the permanent elongation from the as-tightened tension results in inaccurate measurement, particularly when plastic elongation is short. We have found that the best results are obtained by recording the residual value immediately after loosening. The fastener continues to contract a small amount for a period thereafter in what appears to be a recovery mechanism rather than being temperature-related. . It is important to point out using nonlinear calibration for measurement in the plastic range other than for the initial tension after tightening can be very inaccurate. For example, any tension relaxation after tightening into yield would follow Line C-D in Figure l. However, the relaxation predicted by the non-linear calibration would be underestimated, following the same Line B-C used for estimated increasing tension. If service loads were to further increase permanent elongation, it is not assured that Line B-C would be followed. Because the torsional stress is removed, recovery from relaxation could instead follow a parallel path resulting from extending the higher proportional limit due to pure tensile stress. Within limits, subtracting the residual elongation from the linear calibration measurement can still be used in these situations.
SUMMARY
Like any single test that is intended to predict a much wider set of conditions, the key question for these results is how widely and reliably can they be applied. Our experience is the trends and relative accuracy is representative of most applications. The absolute accuracy is less certain. As noted, because the control test setup was the same used to calibrate the torque calibration, variation was essentially a test of calibration repeatability. The 170 accuracy achieved here is achievable over a range of typical applications but can be compromised by short grip lengths, fastener materials, and certain geometries. An estimate of a lower accuracy limit might be 570 with some exceptions. Both non-linearity and slope variation tend to be affected. Poor repeatability with good linearity tends to point to tooling issues that can usually be rectified.
As another point of comparison, we performed a similar test in the elastic range using linear tensile calibration to determine measurement uncertainty for ISO:17025 certification. The result was an expanded uncertainty of 0.816% with a coverage factor of 2. Even for applications at lower limits of calibration accuracy, because it is only available by commercial means in which bolt tension may be measured without functional change to the fastener or the joint members, ultrasonic measurement is still highly effective relative to alternative techniques. Finally, while hardware and software advancements have reduced operator impact and the need for interpretation that were typical of early ultrasonic use, the measuring system and the person using it are still influential.
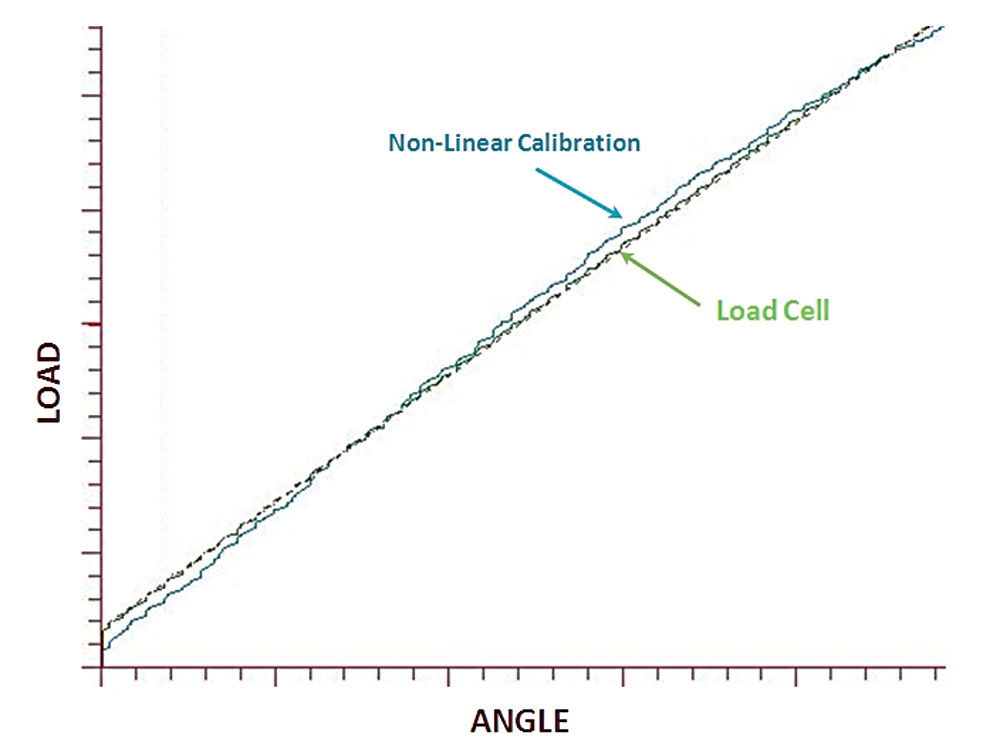
Fig. 2 — Comparison of ultrasonic load calculation using fifth-order calibration relative to “control” load cell measurement.
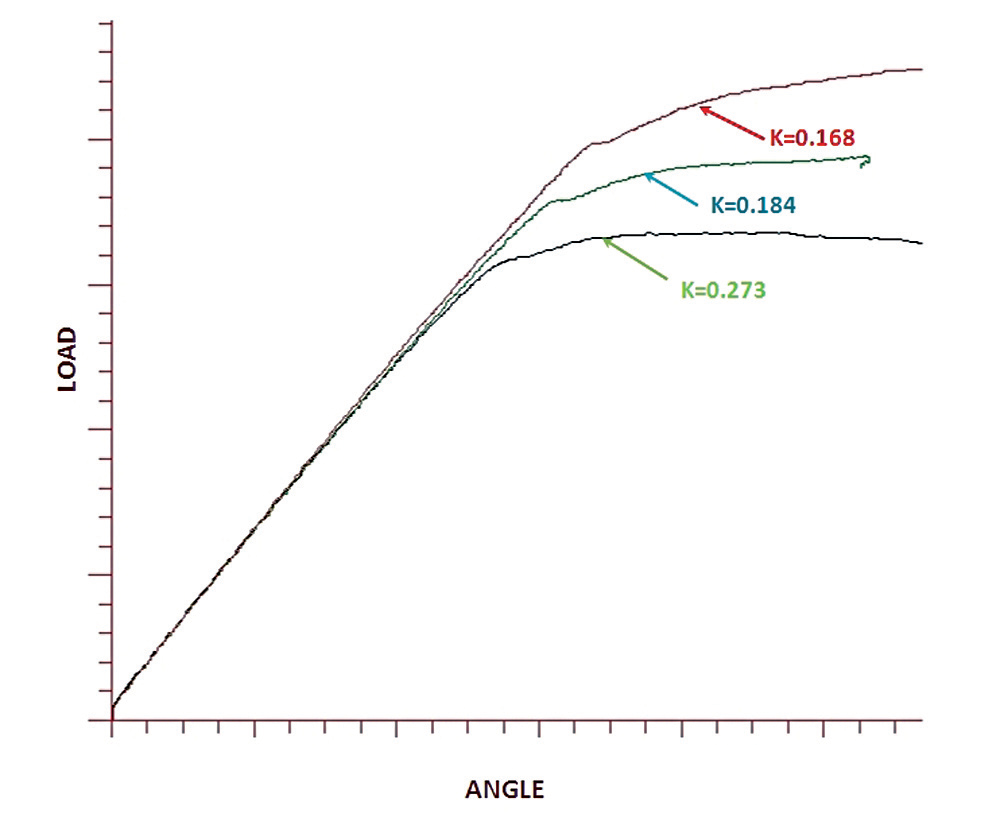
Fig. 3 — The effect of torsional stress on the proportional limit of elongation.
Company Profile:
Peak Innovations Engineering has a highly technical team to design, test, validate, and enhance the bolted joints within your product application. Joint development and testing are all we do, so we do it better than other available options, both internal and external. Why consume your resources in engineering and problem-solving areas that are secondary to your core responsibilities when we can take care of them quickly, definitively, and cost-effectively? www.pieng.com